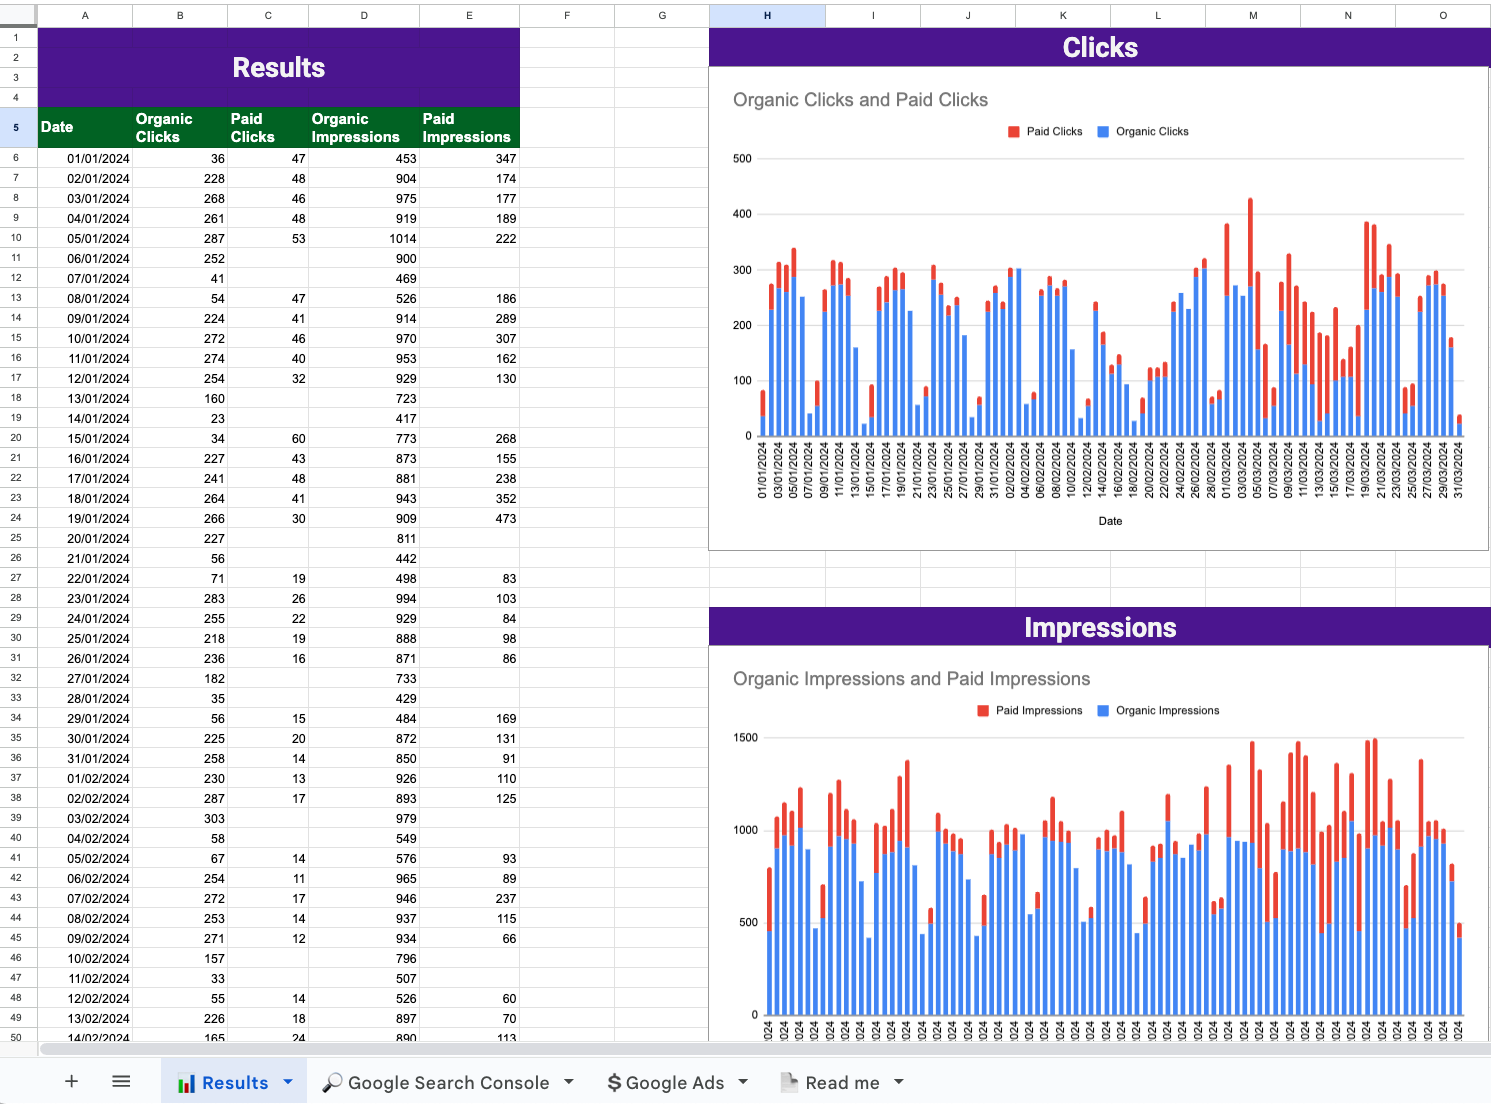
What This Spreadsheet Does
This template helps marketers measure whether their Google Ads are driving incremental traffic or simply replacing organic search traffic they would have received anyway. By combining data from Google Search Console and Google Ads, you can determine the true value of your paid search campaigns.
How It Works
The spreadsheet contains four tabs that work together to analyze your search performance:
Google Search Console Tab
Import your organic search data including daily clicks, impressions, click-through rates, and average positions.
Google Ads Tab
Import your paid search data including daily clicks and impressions from your ad campaigns.
Results Tab
Automatically combines both data sources to show side-by-side comparisons of organic versus paid performance by date.
Read Me Tab
Contains setup instructions and additional resources.
Key Benefits
Measure True Incrementality
Identify whether paid clicks represent new traffic or traffic you would have captured organically.
Optimize Budget Allocation
Make data-driven decisions about increasing or decreasing paid search spend based on actual incremental value.
Improve Reporting
Present clear, defensible analysis to stakeholders about paid search ROI beyond basic metrics like cost-per-click.
Identify Inefficiencies
Spot instances where you're paying for clicks on terms you already rank well for organically.
How to Use
Export Google Search Console Data
Go to Search Results report, select your date range, and export data with Date, Clicks, Impressions, CTR, and Position columns.
Export Google Ads Data
Use Report Editor to create a daily report with Date, Clicks, and Impressions columns.
Import Data
Paste your exported data into the respective tabs in the spreadsheet.
Analyze Results
Review the Results tab to see your organic and paid performance side-by-side, identify trends, and calculate incremental value.
Best Practices
Use Consistent Date Ranges
Ensure both data sources cover the same time periods for accurate comparisons.
Update Regularly
Track performance over time to identify trends and patterns in your search data.
Segment Your Analysis
Consider analyzing branded versus non-branded terms separately for deeper insights.
Enhance Visualization
Add conditional formatting or charts to highlight significant changes in performance.
This template is particularly valuable for marketing teams running holdout tests, optimizing ad budgets, or needing to justify paid search investments to leadership.
